In Python, packages are how you obtain any number of useful code libraries, typically from the Python Package Index (PyPI). Here we show an example that’s a little more complicated, where you use the matplotlib and numpy packages to create a graphical plot as is commonly done with data science.
First, let’s create a new file called plot.py, and paste in the following source code:
import matplotlib.pyplot as plt
import numpy as np

x = np.linspace(0, 20, 100)  # Create a list of evenly-spaced numbers over the range
plt.plot(x, np.sin(x))       # Plot the sine of each x point
plt.show()                   # Display the plot
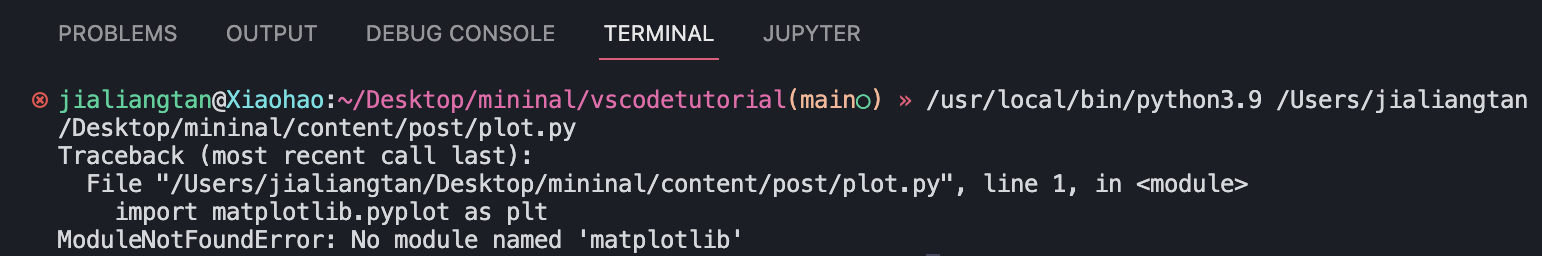
Next, let’s try to run the file.
You will see the ModuleNotFoundError message (unless you have previously installed the matlpotlib):
 Such message indicates that the
 matplotlib package is not available in your system.
Install Matplotlib and Numpy
To install the matplotlib package (which also installs numpy as a dependency), stop the debugger and open terminal (Terminal -> New Terminal).
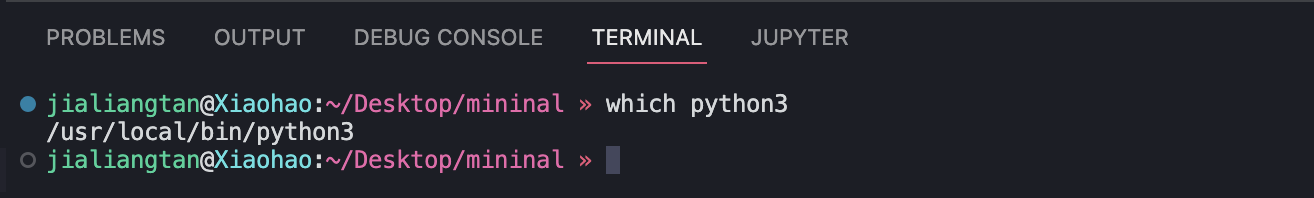
1. Make sure you are using the correct Python3:
In terminal, check your current Python3 path by typing the following command:
$ which python3
The current valid Python3 path will pop out on your terminal. In my case, the Python3 path in current workspace is /usr/local/bin/python3:
Remember how we select Python interpreter in Tutorial 3: View -> Command Palette -> Python: Select Interpreter:
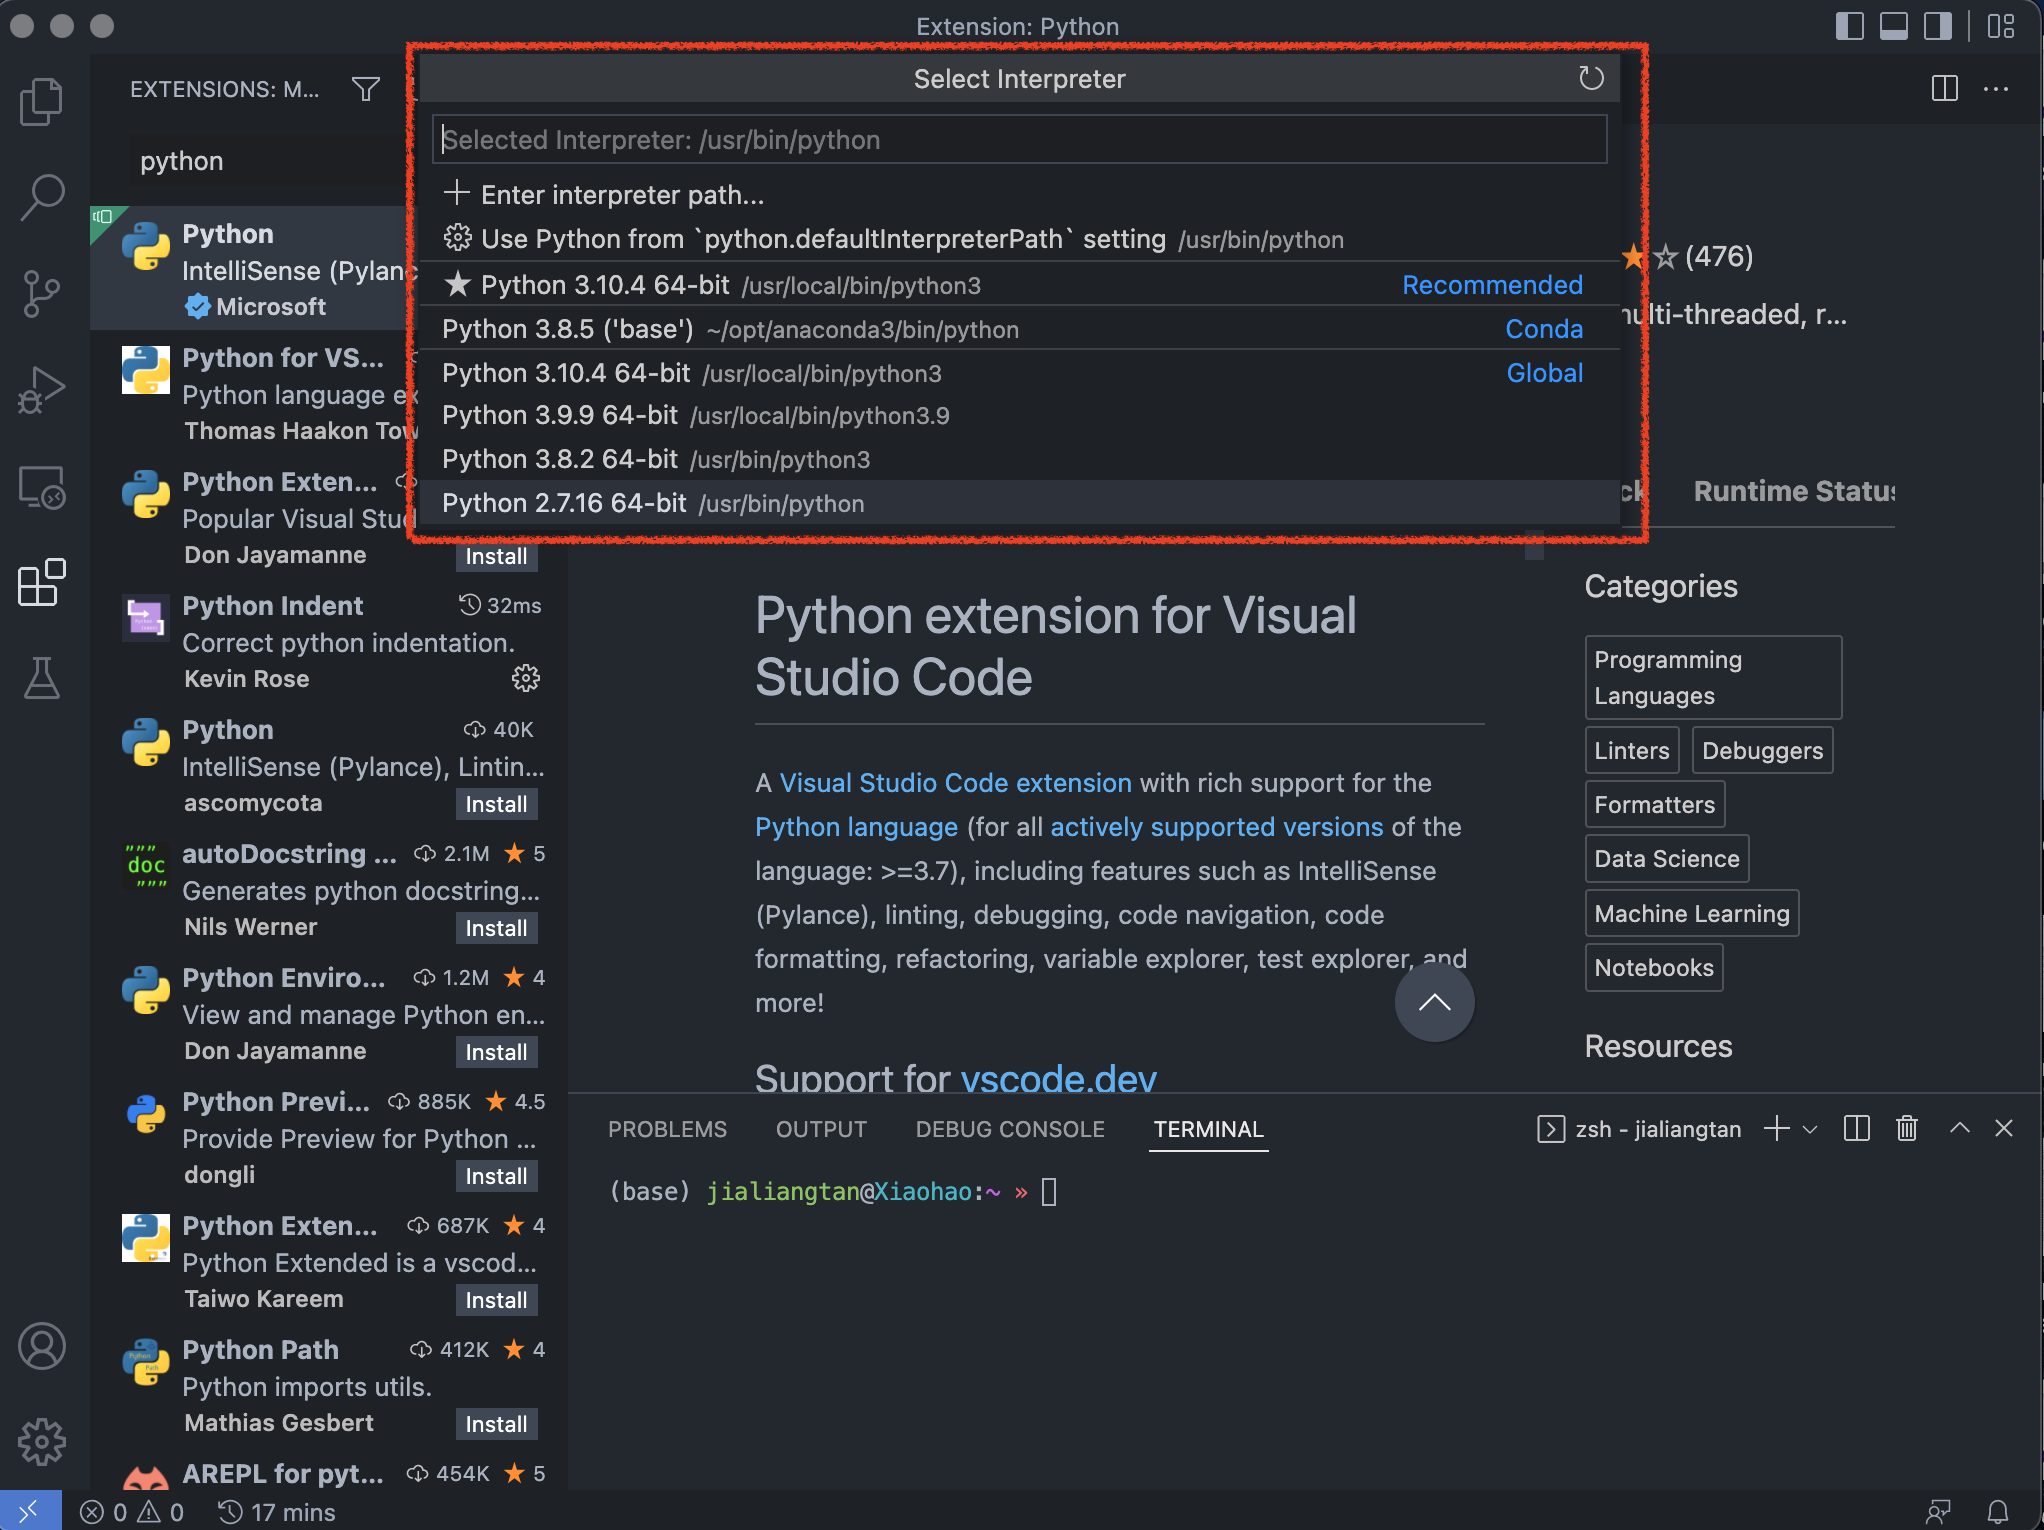
Make sure the path of selected Python is the same as the path printed in your terminal.
For example, I have selected Python 3.10.4 from my Command Palette, and we can see the path of Python 3.10.4 is /usr/local/bin/python3, which is consistent with the path printed on my terminal.
If paths are inconsitent, you may want to Select Python Interpreter again (see Tutorial 3 for more details).
2. Install the package
In your terminal, type the following command to install matplotlib:
python3 -m pip install matplotlib
Upon installation, you should see the message: Successfully installed matplotlib-3.x.x.
3. Rerun the program
Rerun the plot.py now, after a few seconds a plot window appears with the output:
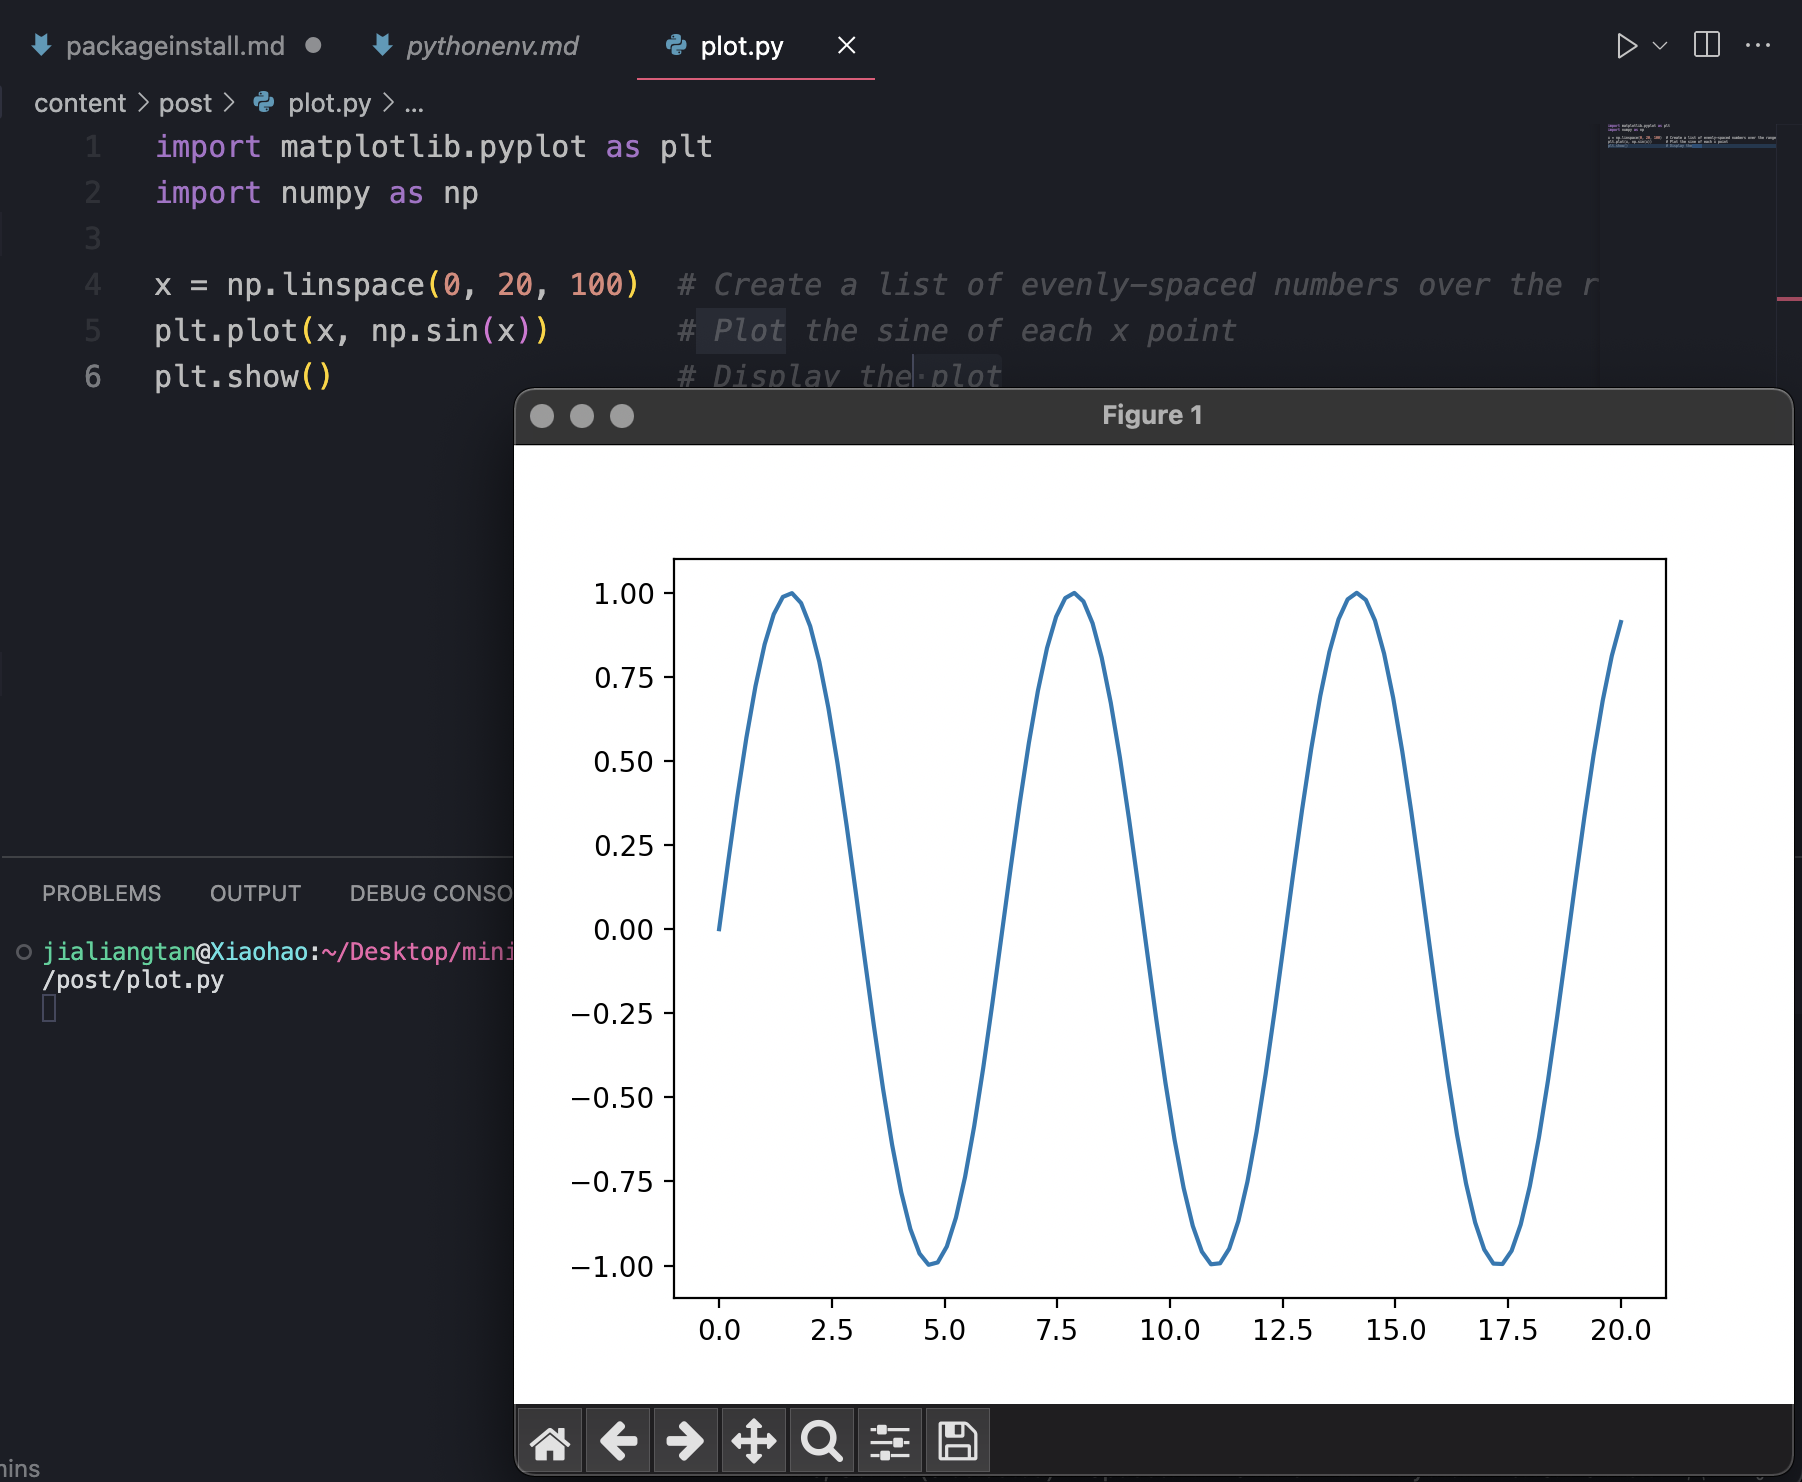
The appearance of the plot results indicates that you’ve succesfully install the matlpotlib and numpy packages!
Install SciPy and Pandas
Similarly, type the following command to install scipy and pandas in your terminal:
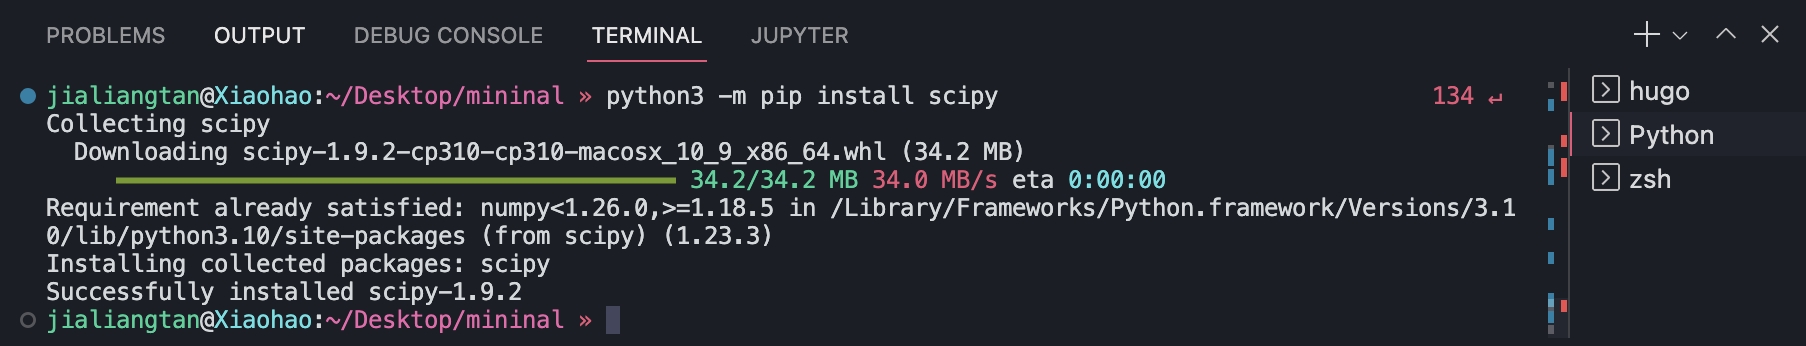
python3 -m pip install scipy
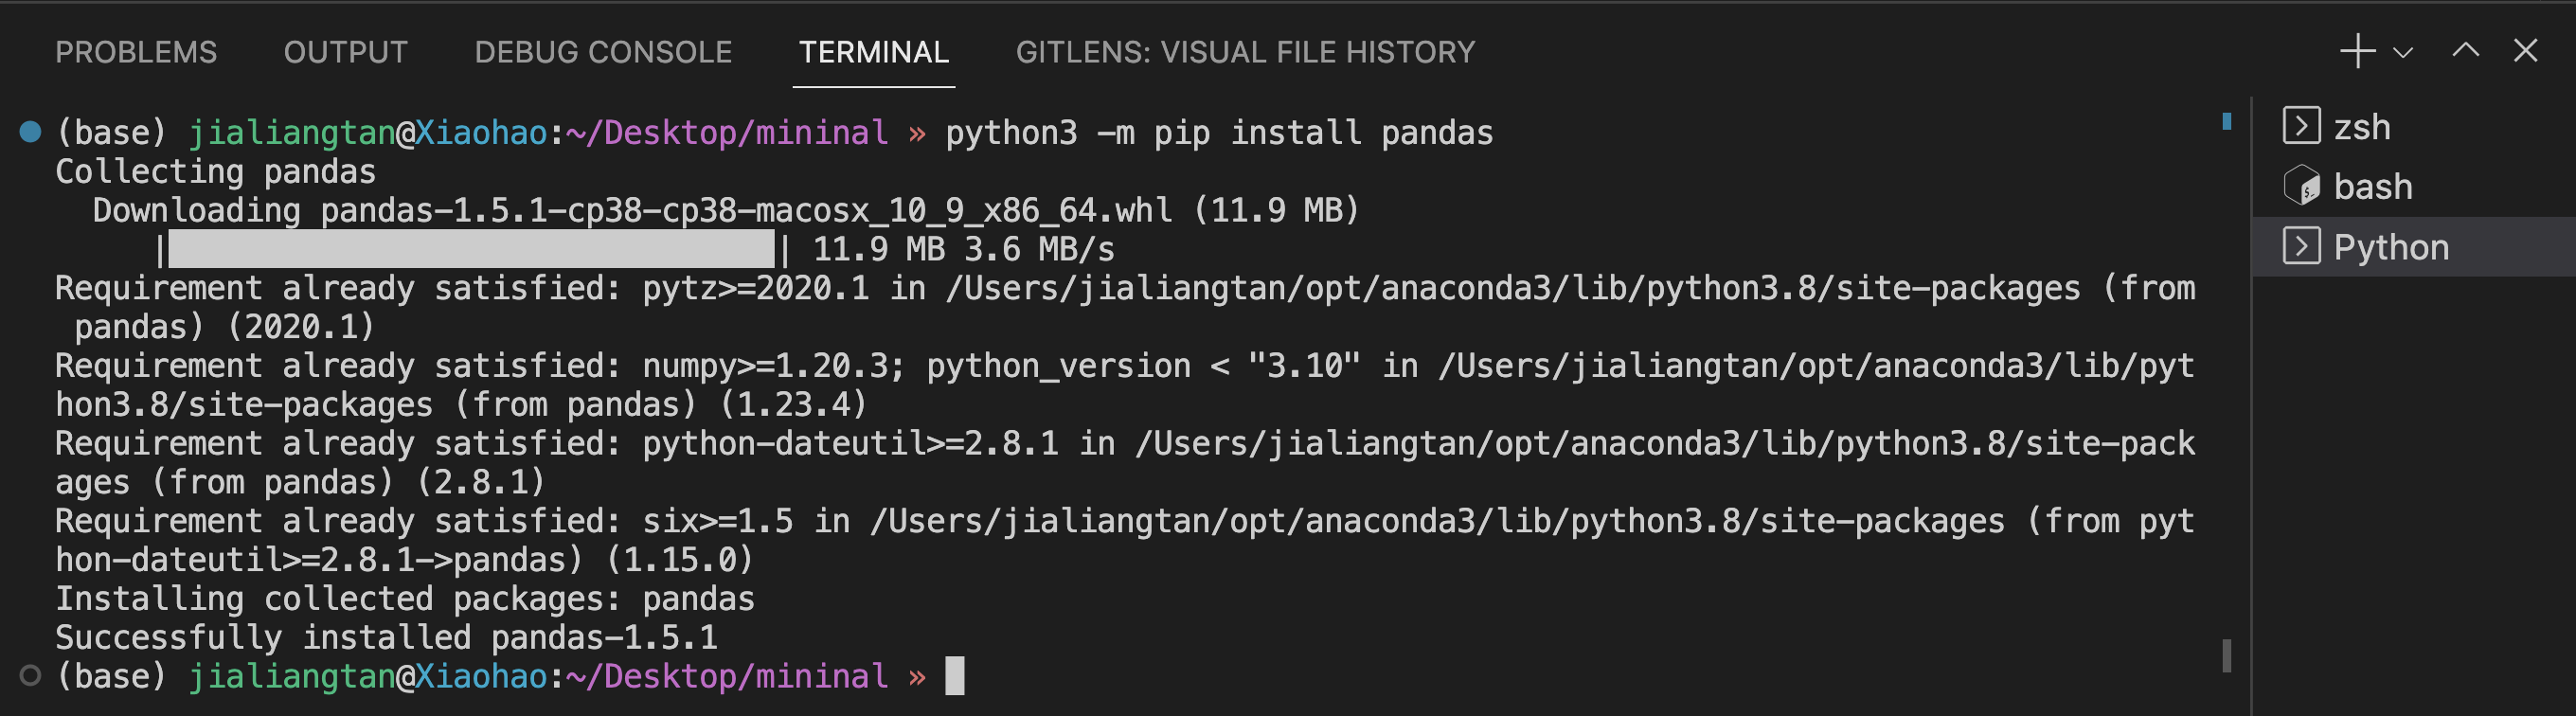
python3 -m pip install pandas
You will see following messages: Successfully installed scipy-1.9.x and Successfully installed pandas-1.5.x upon the successful installations.
!!!Note: the pip command can be used to install packages from PyPI, check PyPI website for more interesting package/software developed and shared by the Python community.
python3 -m pip install "ThePackageName"
Or, simply try:
pip install "ThePackageName"